Spectroscopy Spotlight
Duncan Graham of the University of Strathclyde has been pushing the limits of what can be achieved using functionalized nanoparticles and surface-enhanced Raman spectroscopy (SERS), in applications such as cholera detection, lipid profiling in cancer cells, and assessing the efficacy of anti-cancer drugs, For this and other work he has won the 2017 Charles Mann Award, presented by the Federation of Analytical Chemistry and Spectroscopy Societies (FACSS). He recently spoke to Spectroscopy about this work. read more
|
|
|
Subscribe
Subscribers can enjoy each full issue of Spectroscopy in print, or via Spectroscopy apps.
subscription offers |
 |
|
|
Quiz
This quiz is a regular feature of the “IR Spectral Interpretation Workshop” column. In each installment, we present a quiz. The answers appear in the subsequent installment. read more
|
|
|
Featured Articles
The inherent molecular specificity in the mid-infrared spectral regime allows for trace analysis in liquids, solids, and gases. read more
The number and position of C-O stretches will help us identify functional groups such as alcohols and ethers, and will help us distinguish between members of the same molecular class. read more
|
|
|
Near-infrared (NIR) chemical imaging makes it possible to obtain spectra from individual pixels within a field of view for analysis of complex, heterogeneous mixtures such as flour. read more
Controlling the orientation of the laser and Raman polarization relative to the sample orientation can provide a wealth of information. But it is easy to produce erroneous results, so you need to know what instrumental components affect the observed polarization effects and how the sample setup itself affects the Raman signal. read more
|
|
|
FEATURED PRODUCTS
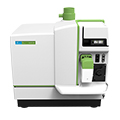 |
PerkinElmer's new NexION® 2000 is the only ICP-MS on the market that can handle any sample matrix, address any interference, and detect any particle size. Discover the effortless versatility of the NexION 2000 ICP-MS.
 Learn more Learn more |
 |
SMALL SPOT benchtop EDXRF elemental analyzer, the Rigaku NEX DE VS delivers wide elemental coverage with Windows®-based QuantEZ software. Non-destructively analyze from sodium (Na) through uranium (U) in almost any matrix.
 Learn more Learn more |
 |
Use OriginPro to import, graph, and analyze spectroscopy data. Create publication-quality graphs including Y-offset, Waterfall, and Contour Profile. Use interactive analysis tools for peak picking, baseline correction, peak fitting, deconvolution.
 Learn more Learn more |
 |
Read the Technical Brief that explains how Acton's proprietary, cost-effective Metachrome and Unichrome coatings extend detection capabilities of CCDs, CIDs, and CMOS sensors into the ultraviolet.
 Learn more Learn more |
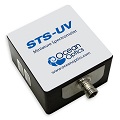 |
For a limited time, Ocean Optics offers a UV irradiance system for about one-third the cost of a typical system. Monitor output from UV curing lamps, horticultural lighting and more.
 Learn more Learn more |
 |
Ondax’s new patented THz-Raman® Probe simultaneously captures low-frequency and chemical fingerprint signals, delivering both chemical composition and molecular structural analysis in a single measurement for any process or lab environment.
 Learn more Learn more |
 |
WITec microscopes routinely perform 3D chemical Raman imaging with the highest sensitivity, measurement speed and spectral quality. TruePower allows automated, software-controlled absolute laser power determination and adjustment in 0.1 mW steps.
 Learn more Learn more |
|
|
|
|
NEW WEBCASTS
Tuesday, February 28, 2017
European Broadcast: 9 am EST | 2 pm GMT | 3 pm CET
US Broadcast: 11 am EST | 10 am CST | 8 pm PST
|
|
|
Wednesday, March 15, 2017
10 am EDT | 2 pm GMT | 3 pm CET
|
|
|
|
|