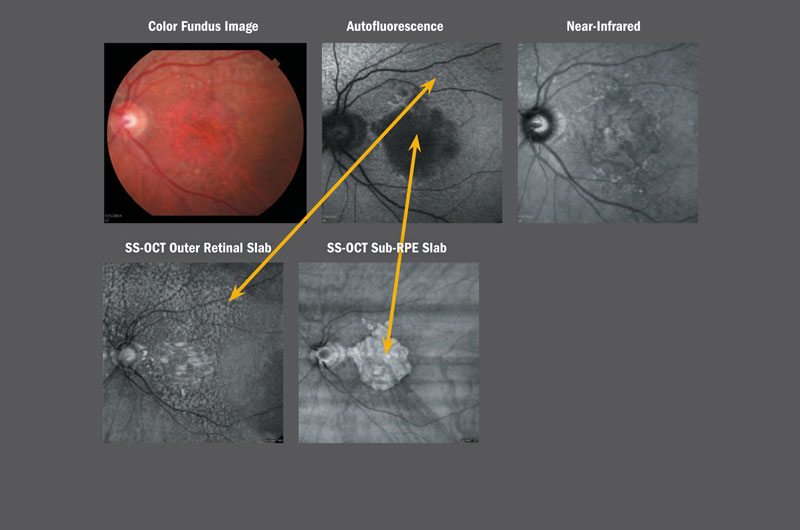
(FIGURE 1) Geographic atrophy with reticular pseudodrusen (RPD) imaged with color fundus imaging, autofl uorescence imaging, and infrared imaging compared with two difference en face OCT images extracted from the same dataset. The outer retinal slab en face OCT image shows the subretinal drusenoid deposits (RPD) while the sub-RPE slab highlights the geographic atrophy.
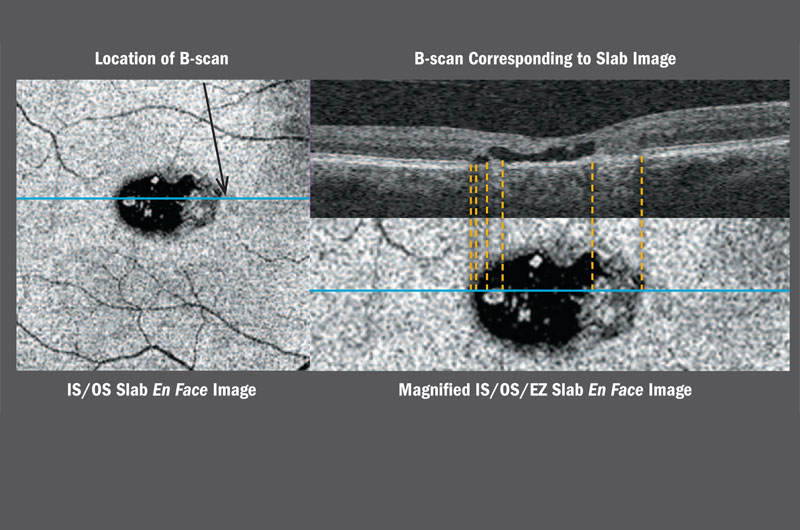
(FIGURE 2) Outer retinal slab en face OCT image showing disruption of the area of phorotreceptor outer segment disruption with loss of the inner segment/outer segment/ellipsoid zone region as observed on the corresponding B-scan. (Figures courtesy of Philip J. Rosenfeld, MD)